Today we are releasing the Anyshift Graph API, direct access to the live knowledge graph Anyshift builds from your stack. Tools, pipelines, and agents can query production relationships and get the same answer every time, in milliseconds. Annie remains the investigation interface. The Graph API is for the recurring questions you want to wire into software.
It ships with a TypeScript SDK, an HTTP API, and MCP support. Get started in the SDK docs.
What this changes:
- Better context: agents work from the live state of production across the SDLC instead of partial or stale data.
- Lower AI cost: resolving production relationships in the graph before inference cut model-token usage by 83.5% in our live benchmark, up to 86% on cross-stack queries, for roughly 59% lower estimated cost.
- Tighter governance: access is read-only, credentials stay protected, and agents do not consume your cloud providers' API rate limits.
Six examples, all backed by real graph queries.
Which alert is paging you for nothing?
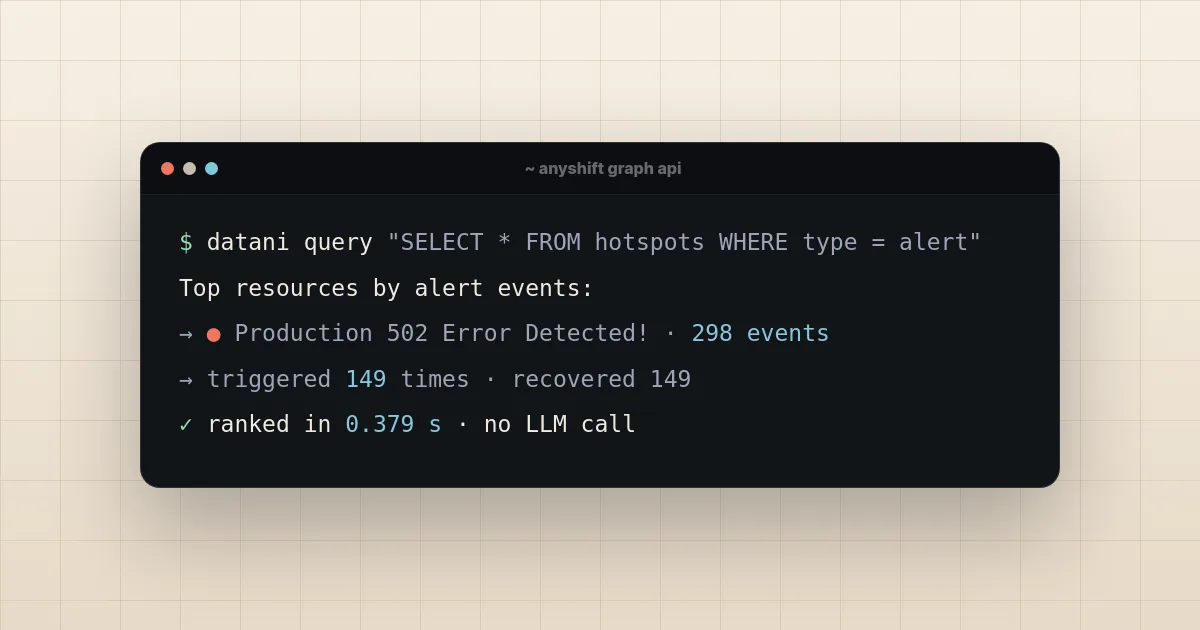
298 alert events. One monitor flapped 149 times. Ranked in 0.379 seconds, from a live environment:
await gx.hotspots({ type: "alert" });That turns an hour of weekly alert triage into a half-second query, with evidence for what to silence.
Live production context inside Backstage
Backstage catalogs your services. Anyshift adds live production context. The reference integration includes:
- An entity tab with dependencies, SLOs, alerts, recent changes, deployment impact, GitOps ownership, safeguards, and C4 diagrams.
- An estate-wide page for Datadog operations, catalog search, changes, impact, and deterministic queries.
- An optional catalog provider that syncs observed components, resources, and evidence-backed
dependsOnrelations.
Queries run through an authenticated Backstage backend plugin, so the Anyshift project ID and token stay server-side. The integration is read-only.
Explore the complete Backstage reference integration.
Developers see production as it is now, inside the catalog they already use. Platform teams stop maintaining a second dependency map.
Which deploy caused the most damage?
Seven deployments in the last hour. One produced 23 correlated failures. Rank them, open the worst one, and the failure types and affected workloads are right there:
await gx.deployImpact({ since: "1h" });You can identify the rollback candidate within minutes or run the same check automatically in your pipeline.
Many failures, one shared cause
18 failing pods across six services. What do they all share? The graph names the shared node, workload, datastore, or external dependency, and how many of the failing pods it touches:
await gx.commonCause({ since: "1h" });The team investigates the shared cause once instead of treating eighteen pods as separate incidents.
A critical CVE just dropped. Where is that image running?
One vulnerable image tag. How much of production is exposed? The answer comes back exact: containers, pods, workloads, namespaces. In our environment, proxyv2:1.29.4 resolves to 10 containers, 10 pods, 5 workloads:
await gx.image({ target: "proxyv2:1.29.4" });When a CVE drops, this gives you the exact exposure in seconds instead of a day spent searching manifests.
What escaped GitOps?
Everything should be managed by ArgoCD. What escaped? The graph lists the unmanaged workloads and namespaces. Pick one and trace it back to its application, repository, and source path:
await gx.gitops({ subject: "unmanaged" });A compliance check that took a day of manual work can now run on every merge.
That is six of roughly forty. Blast radius, RBAC reach, SLO health, topology diagrams and the rest are in the capability reference, with more examples.
What is in the graph
One graph, built from the systems you already run:
By default, the graph includes three days of events, with a longer window available when you need more history.
- Kubernetes: live resources (pods, nodes, containers, configmaps, deployments, services) plus a change feed of what happened to them, from OOM kills and restarts to image rollouts and RBAC changes.
- Cloud: the AWS, GCP, and Azure resources underneath your clusters (EC2, ECS, EKS, Lambda, DynamoDB, CloudWatch), linked back to the Kubernetes workloads they run.
- Codebase and IaC: your Terraform state and config and the GitHub repositories behind them, including which ArgoCD app and repo own each workload.
- Monitoring: services, monitors, alert rules, datastores, external dependencies and metrics pipelines from the observability tools you already use, connected back to the workloads they watch.
- SLOs and alerts: every SLO and the monitors that back it, and every alert as it fires and recovers over time.
A pod, the node it runs on, the config it reads, the deploy that shipped it, the Terraform that defined it, the monitor watching it and the SLO it backs all live in the same graph. So a question that would span five tools becomes one traversal.
Our research on Agentic Context Engineering (ACE) adds learned memory on top of this live graph, carrying forward naming conventions, expected behavior and investigation patterns from previous runs.
Get access
$ npm install @anyshift/graph-sdkThe same graph is available through the CLI, TypeScript SDK, HTTP API, and MCP. The SDK docs cover setup and the full intent reference.