Someone deleted 136 CloudWatch alarms from your production account at 2am. No announcement in Slack. No maintenance ticket. You find out three days later when an RDS instance runs hot and nobody gets paged.
That kind of question, the kind that spans three systems and two teams, is the reason we built Anyshift. And now you can ask it from your terminal.
Install
$ brew install anyshift-io/tap/annie
$ annie auth login
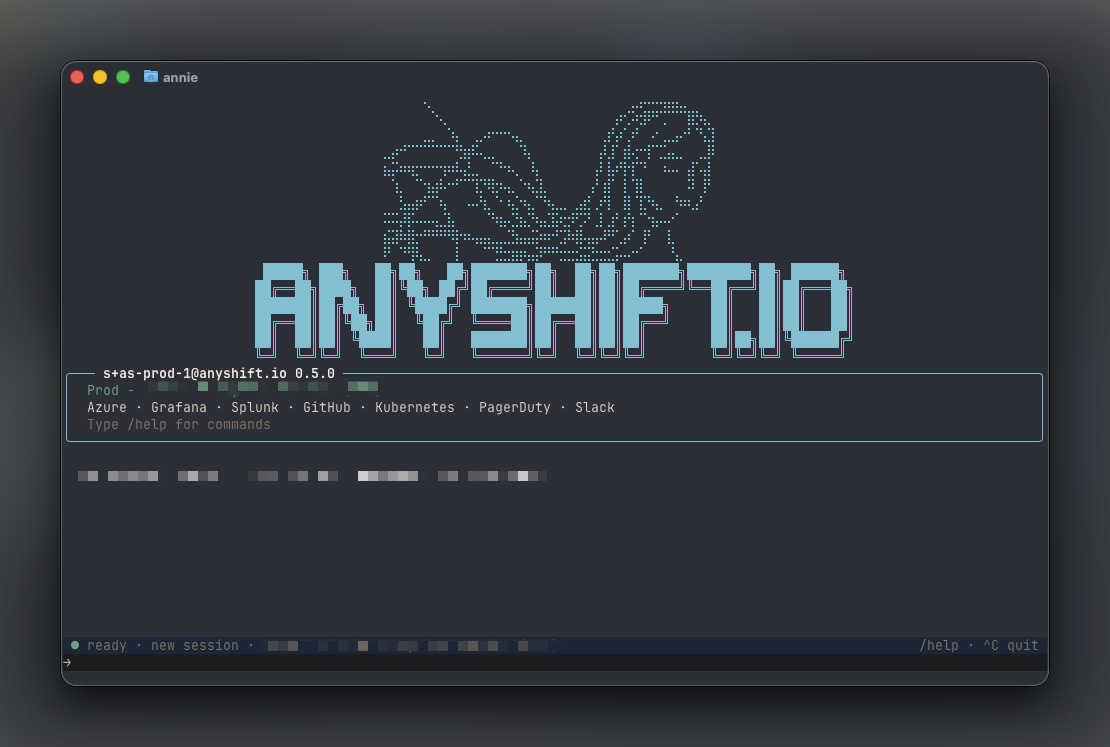
$ annieAnnie CLI is a native terminal tool (macOS and Linux) that gives you access to the full Anyshift knowledge graph. Interactive TUI, one-shot queries, piped input, JSON output. Same analysis engine, no browser.
Let me show you what it looks like in practice.
One question, three systems
This is real output from a customer environment. One prompt. Annie checks the CloudTrail audit log, searches Slack for context, and verifies the current state.
➜ What CloudWatch alarms were recently deleted, and was this change
  planned according to Slack communications?

CloudWatch Alarm Deletion Analysis
----------------------------------

🚨 The Deletion Event (March 12, 2026)
- 136 CloudWatch alarms were deleted from account 721296******
- Time window: 02:11–10:11 UTC on March 12, 2026
- Type of alarms deleted: All were generic/shared RDS monitoring alarms
- Alarms that survived: 62 client-specific alarms

📢 Slack Communications
-----------------------
No planned maintenance announcements found. I searched the #ops-sre
channel and found no communications about planned CloudWatch alarm
changes or maintenance windows around the March 12 timeframe.

📊 Current State
----------------
As of today (March 17, 2026), there are 198 CloudWatch alarms in
account 721296******. This matches the pre-deletion count (136 deleted
+ 62 survived = 198), suggesting the alarms have been recreated or
restored since the deletion event.
The answer isn't "136 alarms were deleted." The answer is "136 alarms were deleted, nobody talked about it, and they've since been restored." Three systems, one query, roughly four seconds.
This is what Annie does. It doesn't search logs. It traverses a knowledge graph that maps your entire infrastructure: cloud accounts, Kubernetes clusters, CI/CD pipelines, Slack channels, alerting rules, code changes. The relationships between things are what make the answers useful.
Pipe in anything
This is where the CLI pulls ahead of a web UI. Annie reads from stdin, so you can throw whatever you're already looking at and get analysis grounded in real data.
$ kubectl get events -A | annie ask "anything unusual?"

Looking at these Kubernetes events from the rbl namespace, I can spot
1 notable item:

🔴 Storage Issue (Concerning)
-----------------------------

PersistentVolumeClaim binding failure (81 seconds ago):

• PVC: redis-data-rbl-mission-ctrl-redis-replicas-0
• Error: "no persistent volumes available for this claim and no storage
  class is set"
• Impact: This Redis replica pod likely cannot start because it has no
  persistent storage to bind to
Annie read the raw events, found the one that matters, and explained the impact on your running workloads. Pipe in Terraform plans, CI output, error logs, whatever. If it's text, Annie can work with it, and it combines what you piped with what it already knows about your stack.
For quick checks without a full chat session, annie ask prints the answer and exits. Add --output json to pipe Annie's responses into your own scripts.
Try it
$ brew install anyshift-io/tap/annieYour infrastructure already has a memory. Now it fits in your terminal.