TL;DR
A checkout service failed its readiness checks. PagerDuty routed the alert to the on-call engineer, while Anyshift traced the production dependencies behind it. That context let the engineer assess the blast radius before remediation, reducing the risk of fixing one service while breaking another.

What does the page tell the engineer, and what is missing?
Every incident raises two questions: what failed, and what could fail with it? PagerDuty turns a monitoring signal into an incident and routes it through an escalation policy and on-call schedule, answering the first question for the right engineer.
The second question defines the blast radius. During a P1 incident, restarting one pod could remove the last healthy endpoint from a shared path.
At Northstar Market, a fictional online retailer, checkout-api pods were running but failed their readiness probe on port 8081. Kubernetes stopped routing traffic, and PagerDuty paged the checkout team. The alert showed the failure, but not how much of checkout depended on it.
What could fail with checkout-api?
Before changing anything, the on-call engineer followed four questions:
1. Which production deployment is actually failing? Confirm the exact deployment and environment named by the alert.
2. Is this failure isolated or recurring? Check whether the probe failure is part of a broader pattern.
3. If I change this deployment, what else could be affected? Trace its downstream blast radius before restarting or remediating it.
4. Do other services share a datastore discovered on that path? Check whether shared state extends the blast radius beyond direct dependencies.
These questions shape the order of the Anyshift Graph SDK investigation. It first resolves the production deployment, then checks its failure history and service tree. If the service tree reveals shared state, the integration follows that datastore next.
Initial PagerDuty alert
{
  "component": "checkout-api",
  "signal": "readiness probe failed"
}
The PagerDuty alert identifies checkout-api, but the same name could exist in several environments or resource types. Anyshift matches it to the Kubernetes deployment running in the production checkout namespace. This gives every following query one exact starting point.
Anyshift input: Which production deployment is actually failing?
# 1. Which production deployment is actually failing?
annie graph query \
  "SELECT * FROM resolve
   WHERE term = checkout-api
   LIMIT 10" \
  --output json
Anyshift output: checkout-api resolves to one production deployment.
{
  "name": "checkout-api",
  "type": "K8S_DEPLOYMENT",
  "namespace": "checkout",
  "cluster": "anyshift-demo-eks"
}
Explanation: The result pins checkout-api to one deployment, namespace, and cluster, so later queries do not mix resources from different environments.
Next step: Northstar's on-call engineer now wants to know whether the failure is recurring and what a change to checkout-api could affect.
The CLI below shows those queries through the Anyshift Graph Query Language:
Anyshift inputs: Is the failure recurring, and what could be affected?
# 2. Is this failure isolated or recurring?
annie graph query \
  "SELECT * FROM failures
   WHERE target = checkout-api
     AND namespace = checkout
     AND since = 90d
   LIMIT 100" \
  --output json

# 3. If I change checkout-api, what could be affected?
annie graph query \
  "SELECT * FROM servicetree
   WHERE target = checkout-api
     AND source = auto
   LIMIT 30" \
  --output json
Anyshift output: The failure has recurred across 90 days.
{
  "failure_events": 53,
  "pod_unhealthy_events": 44,
  "pod_failed_scheduling_events": 9,
  "readiness_probe_8081_events": 4
}
Explanation: Anyshift found 53 failures over 90 days: 44 unhealthy-pod events and 9 scheduling failures. Four were readiness-probe connection failures on port 8081. This is a recurring pattern, so a restart alone may not resolve it.
Anyshift output: checkout-api reaches 12 services and two datastores.
{
  "downstream_services": 12,
  "datastores": ["redis-cart", "checkout-postgres"]
}
Explanation: The service tree identifies two datastores behind checkout-api: redis-cart and checkout-postgres. Because checkout-postgres may also serve workloads outside the direct call chain, the engineer next asks which other services depend on it.
Anyshift input: Which other services share checkout-postgres?
# 4. Which other services share checkout-postgres?
annie graph query \
  "SELECT * FROM datastore
   WHERE target = checkout-postgres
     AND source = auto
   LIMIT 30" \
  --output json
Anyshift output: Three services share checkout-postgres.
{
  "datastore": "checkout-postgres",
  "dependent_services": ["checkout-api", "order-creation-worker", "checkout"]
}
Explanation: checkout-postgres is shared by checkout-api and two other services: order-creation-worker and checkout. This does not prove that PostgreSQL caused the incident. It shows that a change affecting the shared datastore could affect all three services, so the engineer should not treat checkout-api as isolated.
Now that the four Anyshift queries have returned the incident context, a JavaScript function maps those values into PagerDuty's custom_details fields.
Integration output: fields sent to PagerDuty (cropped)
{
  "affected_component": "checkout-api",
  "failure_events": 53,
  "readiness_probe_8081_events": 4,
  "downstream_services": 12,
  "datastores": 2,
  "shared_datastore": "checkout-postgres",
  "shared_datastore_services": 3
}
Explanation: checkout-api is not isolated: its path reaches 12 services and two datastores, while checkout-postgres is shared by three services.
How the context lands in PagerDuty
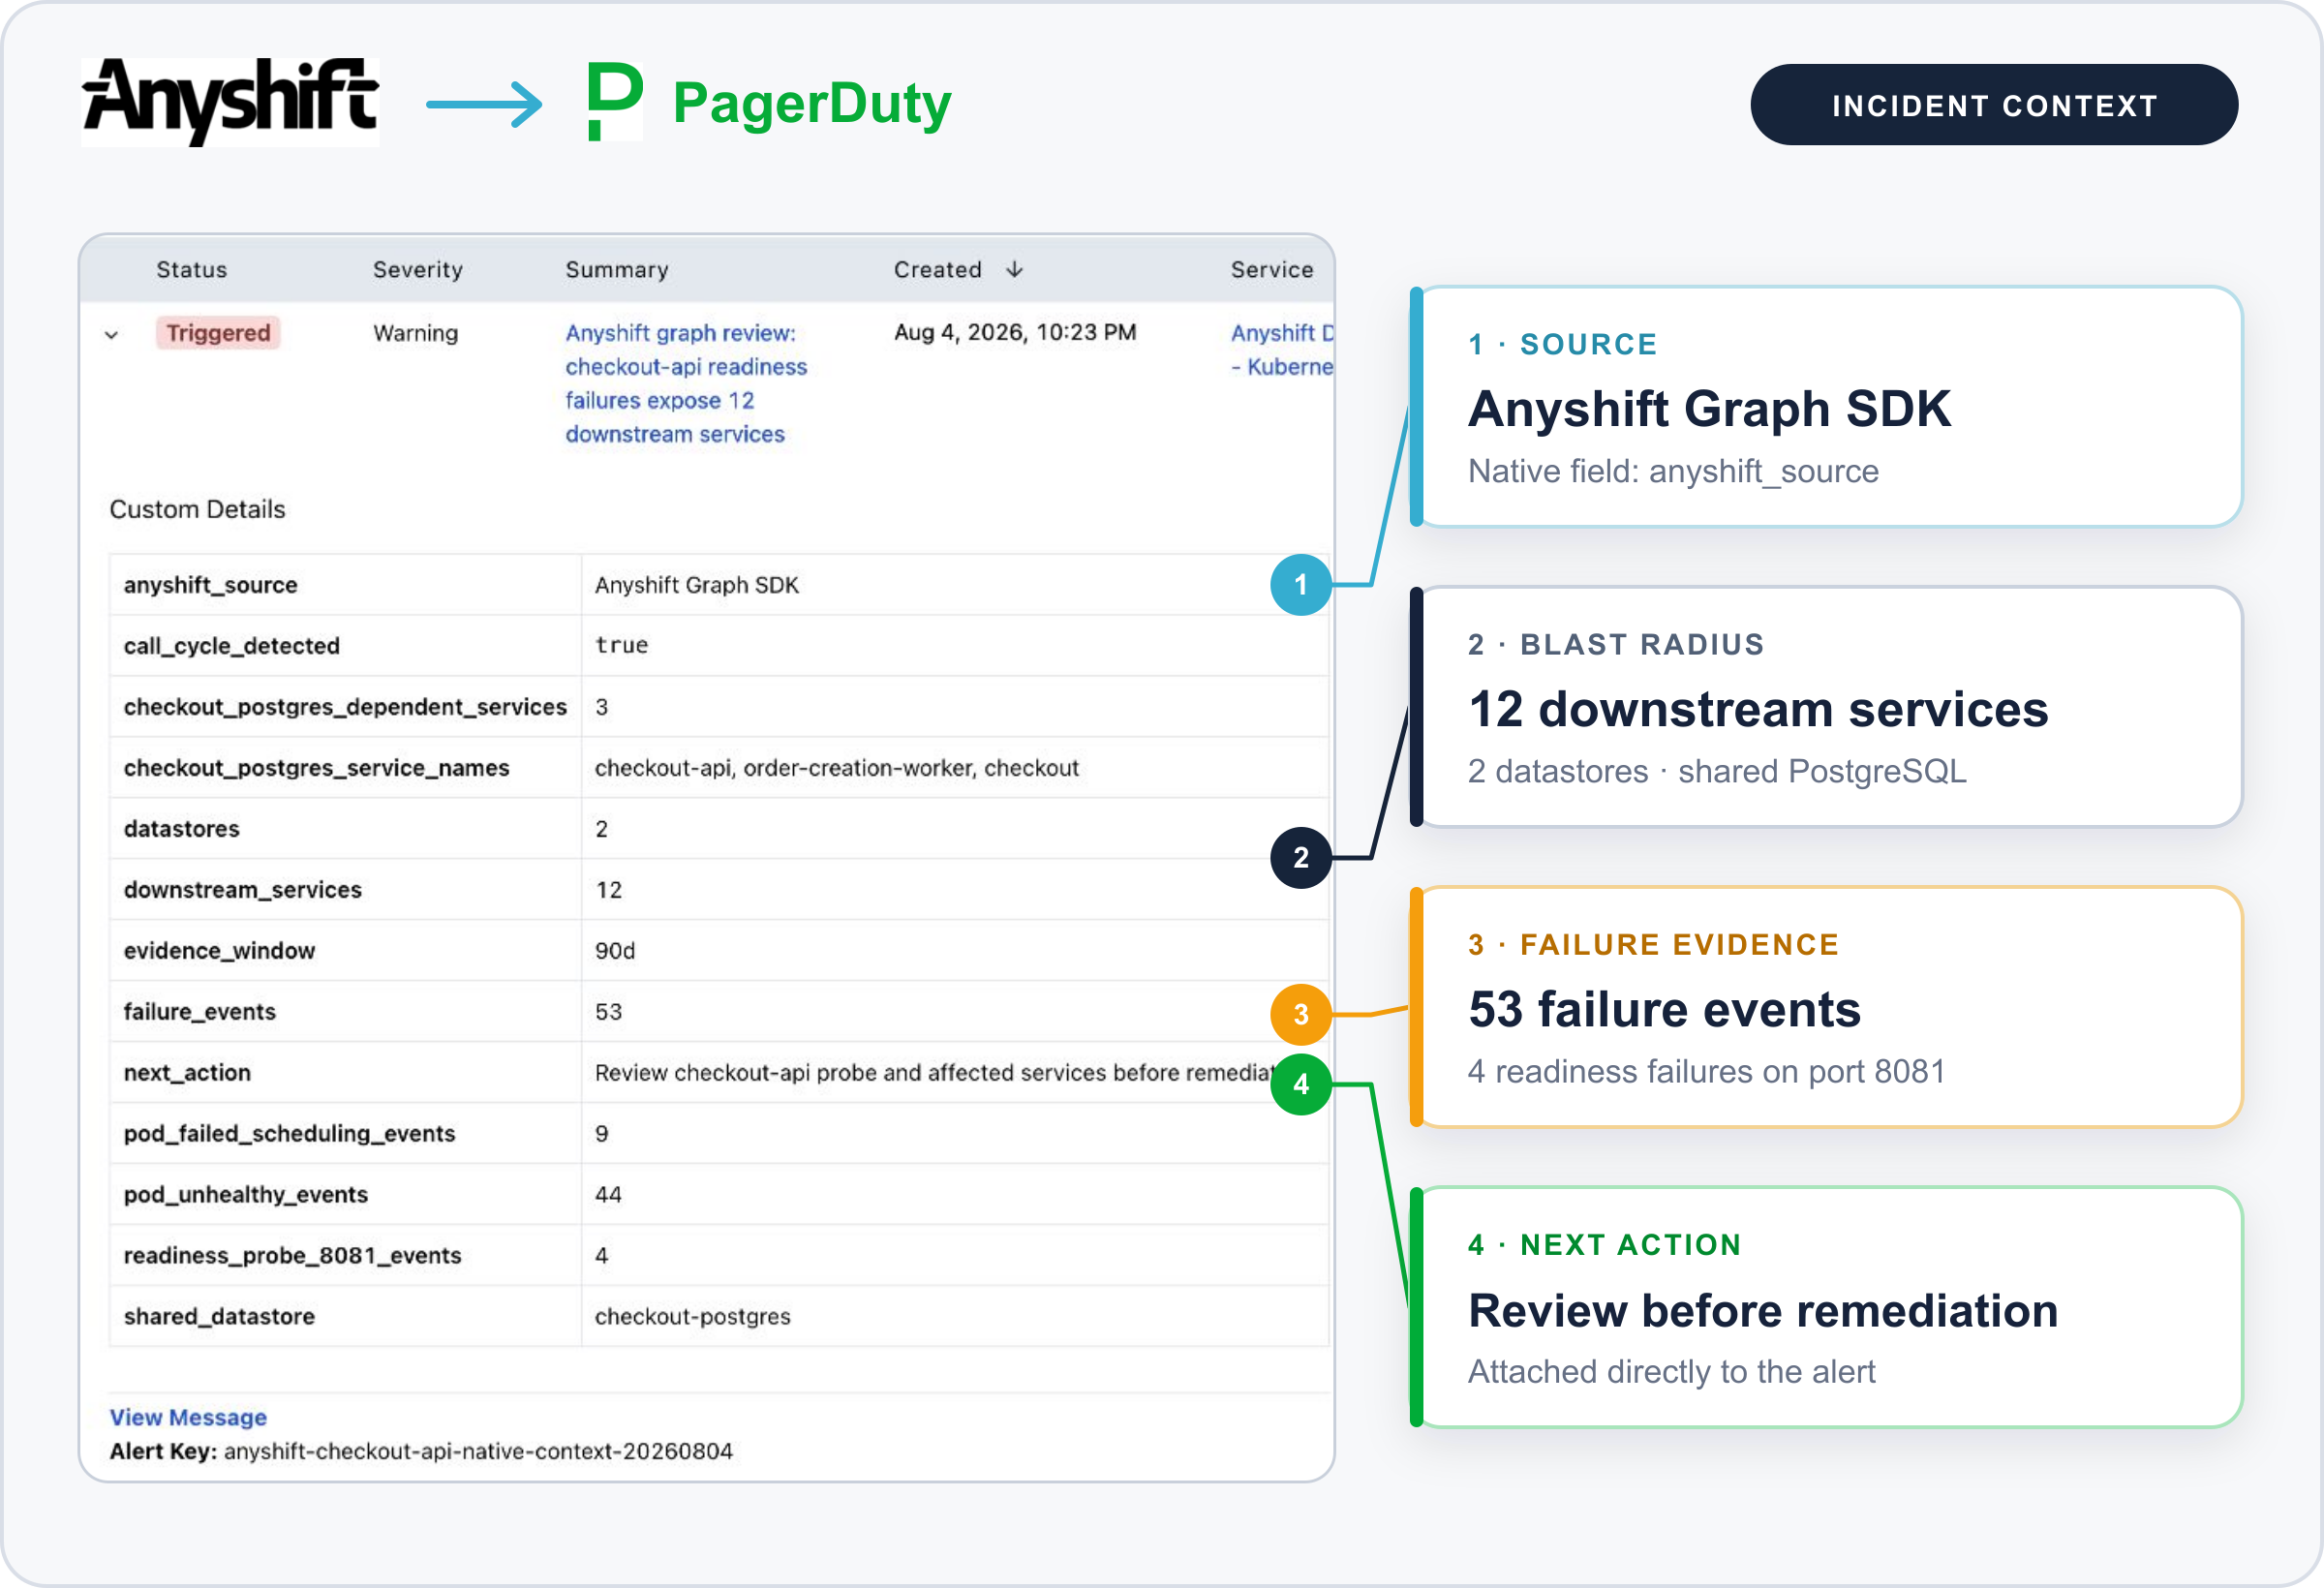
The integration sends the Anyshift context through the PagerDuty Events API v2 as native custom_details. The failure history, downstream footprint, and shared datastore stay attached to the incident that PagerDuty routes and manages.
The screenshot below shows the accepted alert with those values in PagerDuty Custom Details.
How does this work without an engineer manually running SDK calls during a P1? In the automated path, Anyshift listens for an incident.triggered webhook through its PagerDuty integration, runs the same investigation, and posts the root-cause analysis back as incident notes and into the mapped Slack thread.
Which question does PagerDuty need answered next?
More graph data is not automatically more useful during an incident. Each response step needs the smallest slice of context that can change its next action.
pagerduty_alert: [component, signal]
anyshift_graph: [cause, blast_radius, safety, recovery]
pagerduty_response: [route, investigate, automate, close]| Moment | Question | Anyshift supplies | PagerDuty acts |
|---|---|---|---|
| Before the page | Who is affected, and how urgent is this? | Blast radius, SLO risk, and alert-noise context | Event Orchestration sets priority, routing, or suppression |
| During triage | What changed, and how did the failure spread? | Likely cause and the relevant dependency path | SRE Agent investigates that production path |
| Before remediation | Could this action make the incident worse? | Disruption-budget, scaling, storage, and access checks | Automation Actions runs after the safety check |
| Before closing | Has the service and its dependency path recovered? | Fresh alert, SLO, and audit evidence | Incident Workflows verify recovery and retain the evidence |
Why make the context structured instead of adding a prose note? PagerDuty supports SRE Agent connectors through MCP or APIs, while external data variables can put API-supplied facts into orchestration rules. Blast radius or SLO risk can then become a routing condition, not just a note someone must remember to read.
The same question-first contract works when an alert points to a failing node, a risky deploy, a vulnerable image, or a shared Kafka topic. The Anyshift Graph SDK capability guide lists the corresponding change, security, stream, topology, and Kubernetes safety queries.
The reusable principle is simple: before changing the failing component, ask what else moves with it. Then put that answer where the on-call engineer will make the decision.
Using PagerDuty and facing an incident like this? Send it to us.