This case study tests one workflow: write production-change context into Dash0 before an incident review starts. Dash0 is an OpenTelemetry-native observability platform for traces, metrics, logs, dashboards, and alerts. Anyshift is the production graph that connects code and infrastructure changes to live services, dependencies, owners, and non-production paths to skip.

Summary
Dash0 can ingest and query OpenTelemetry data. A Dash0 log event is an OpenTelemetry log record with an event name, and Dash0 can use those events in views and dashboard annotations.
In this example, platform-infra#1923 changes an RDS timeout parameter. The primary service is checkout-api, but Anyshift's production graph also finds billing-worker on the same RDS parameter group. checkout-sandbox has a similar shape, but it is not production, so the workflow skips it.
The value is simple: write the production-change marker onto every affected Dash0 service timeline before people start debugging symptoms. When latency moves later, the team sees the PR, shared dependency, owners, and review decision next to the telemetry.
The Production Change
The workflow starts before there is a full incident. A platform change has landed:
platform-infra#1923changed an RDS timeout parameter;checkout-apiis the service most likely to show latency first;billing-workershares the same RDS parameter group;checkout-platformandbilling-platformare the owners in scope;checkout-sandboxis excluded because it is not production.
Dash0 observes telemetry. Anyshift answers a different question: which production services should carry the change marker, even before they fail?
The Context Anyshift Adds

This is not another service map claim. The useful part is the upstream graph relation:
- the code/IaC change is
platform-infra#1923; - the shared dependency is
rds-parameter-group/checkout-prod; - the affected production services are
checkout-apiandbilling-worker; - the owners are
checkout-platformandbilling-platform; - the skipped path is
checkout-sandbox.
Trace-derived views are strongest after traffic is observed. The Anyshift graph is useful at change time: it can mark shared production paths before the symptom window becomes noisy.
How Anyshift Runs It
The operator asks Anyshift's annie do workflow to prepare the Dash0 write:
annie do --show-yaml "emit Dash0 service events for platform-infra#1923 shared RDS impact"annie do is Anyshift's reviewed workflow surface. It renders a deterministic OTLP/HTTP payload, then Dash0 receives it through its native ingestion endpoint using the Dash0-Dataset header.
The reviewed answer stays compact:
decision: mark checkout-api and billing-worker before latency investigation
dash0_write: OTLP/HTTP log events
event_name: anyshift.production_change
resource_logs:
  - service.name: checkout-api
    owner: checkout-platform
    dependency: rds-parameter-group/checkout-prod
  - service.name: billing-worker
    owner: billing-platform
    dependency: rds-parameter-group/checkout-prod
skipped:
  - checkout-sandbox: non-production
Each service receives its own OpenTelemetry resource log with service.name, otel.event.name, code.pr, anyshift.shared_dependency, owner, and the review decision.
The Result In Dash0
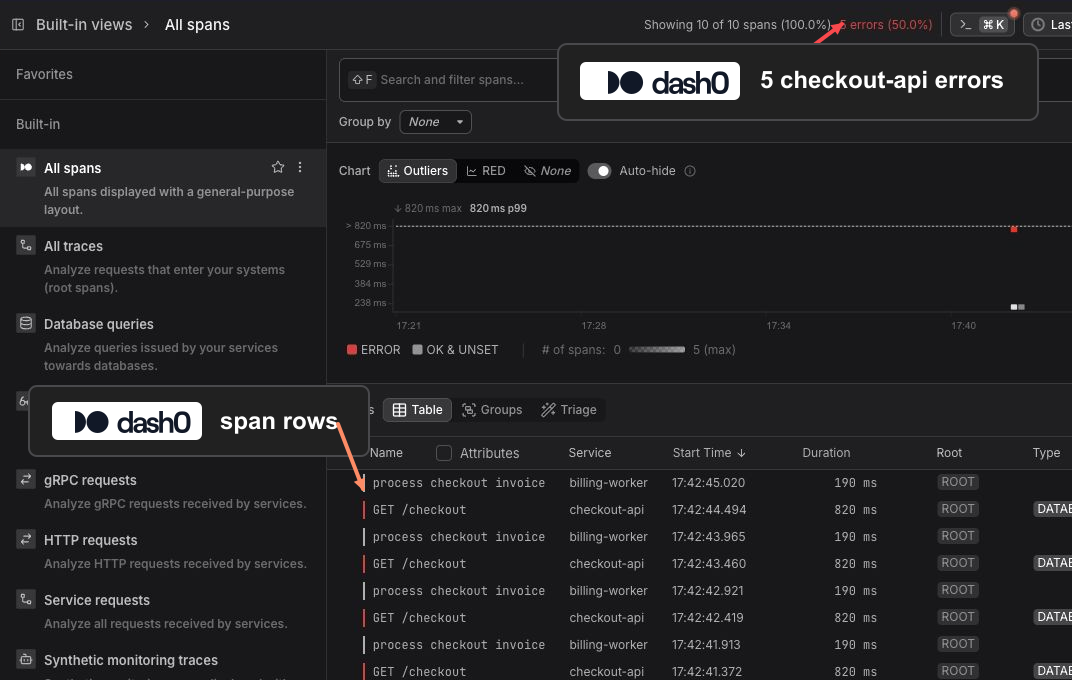
The real Dash0 tracing view from the same tenant shows the telemetry window behind the example: 10 spans, 5 checkout errors, checkout-api rows, and billing-worker rows in the same time window.
The Dash0 write is a standard OpenTelemetry log event, not a separate Anyshift UI object. The workflow sends one event for each affected service with fields such as eventName, service.name, code.pr, anyshift.shared_dependency, owner, and decision.
We verified the write path in the same Dash0 sandbox with a demo event using the same anyshift.production_change shape. Dash0 stores the Anyshift context as queryable event attributes.
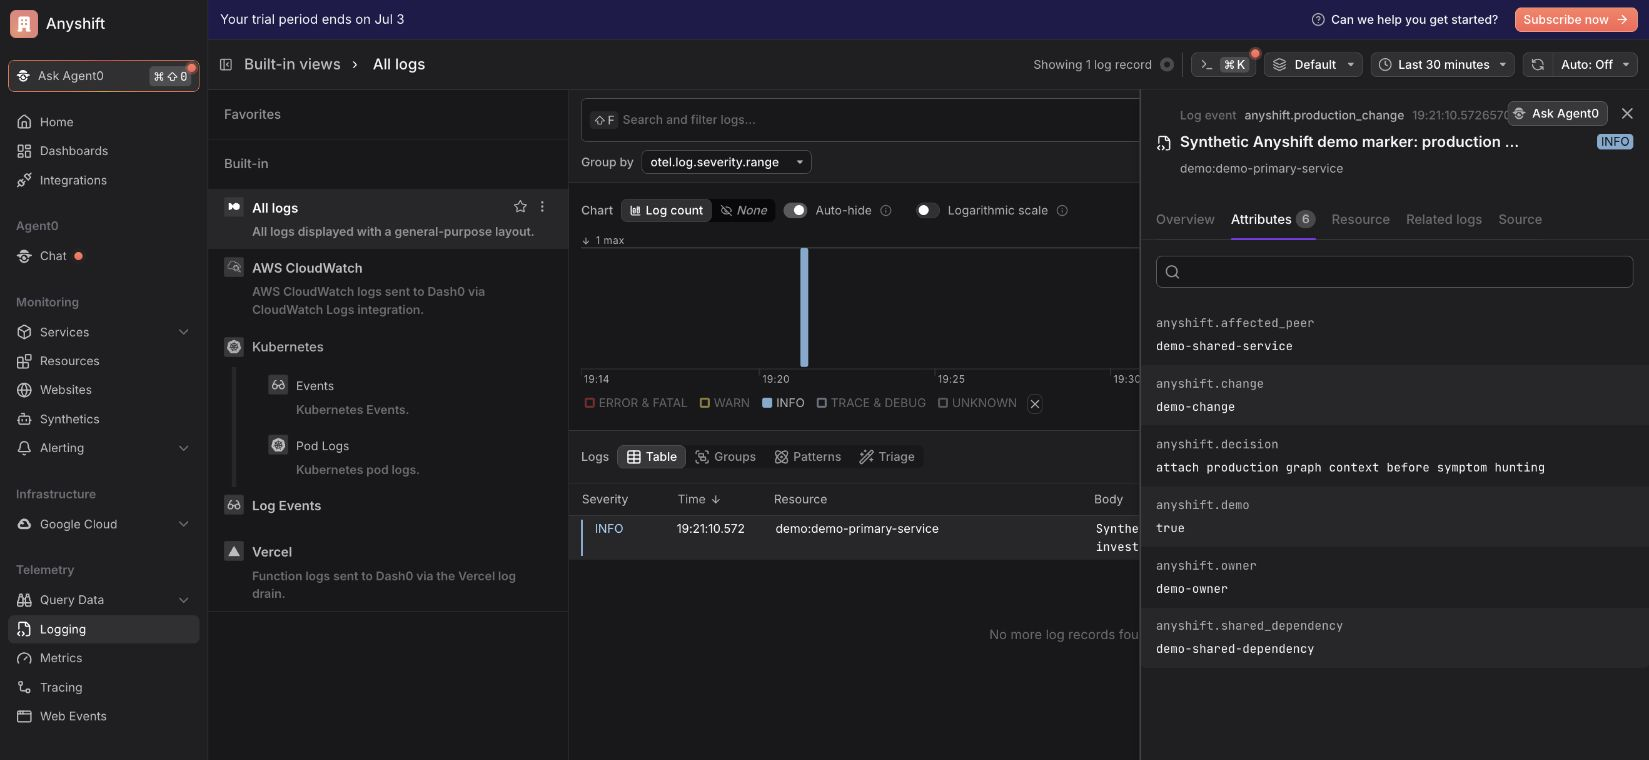
Dash0 keeps the telemetry view and the native event model. Anyshift adds the upstream change context that makes those timelines easier to read later.
Why This Is Useful
This is not "Dash0 lacks graph." Dash0 can build rich context from the telemetry it receives. The gap this workflow targets is earlier and narrower: a production change can affect a shared dependency before every affected service has produced an obvious symptom.
Anyshift writes that upstream context into Dash0 at change time:
- which PR or IaC change moved;
- which production services share the dependency;
- which owners should review the change;
- which similar-looking paths are non-production;
- what the safe next action is.
For the on-call or SRE, the question becomes less "what changed?" and more "which marked change should I inspect first?"
What Teams Get
The integration keeps Dash0 as the observability surface and uses OpenTelemetry as the write path. Anyshift adds the production graph before the event lands.
Teams get:
- change markers on all affected production services, not only the primary service named in the request;
- owner and dependency context attached as queryable event attributes;
- a cleaner incident timeline when latency or errors appear later;
- less manual reconstruction of shared infrastructure impact.
If your team uses Dash0 and wants production-change markers written onto the right service timelines before incident archaeology starts, contact us.