TL;DR: Coralogix is where SREs investigate telemetry: logs, DataPrime queries, dashboards, and alert context. Anyshift adds the production graph around that signal: affected service, owning team, recent deploy, dependency evidence, and non-production skip reasons. After review, annie do writes the handoff into a Coralogix Custom Dashboard through Coralogix's DataPrime and Dashboards API.
Coralogix references: Custom Dashboards, DataPrime, DataPrime widgets, Dashboards API, and application/subsystem names.
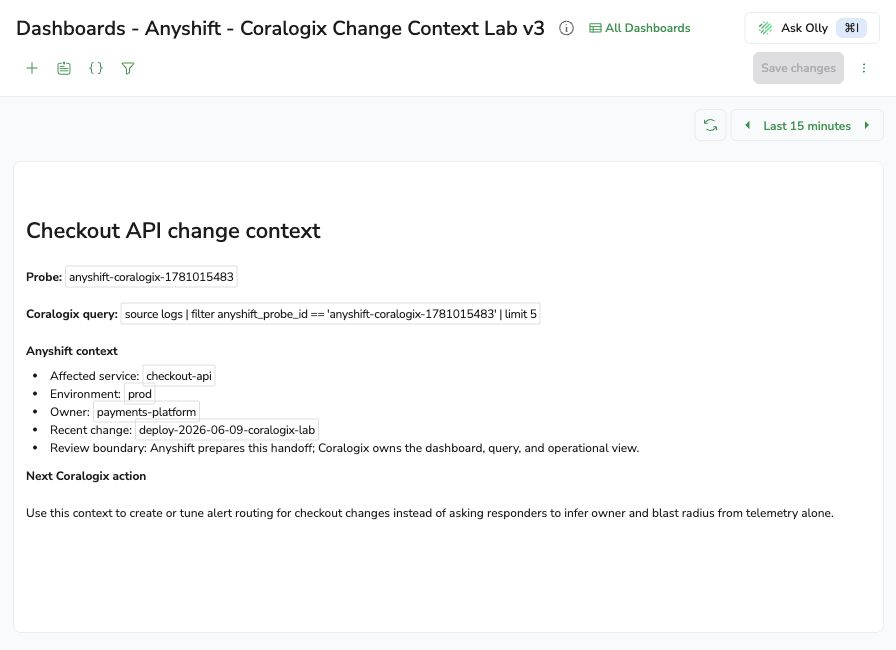
A Checkout Signal Needs A Production Handoff
An SRE sees a checkout-api signal in Coralogix during a checkout rollout. Coralogix has the telemetry surface: the application and subsystem, log event, DataPrime query, dashboard, and alerting workflow.
The missing part is the production handoff. A log line can say checkout-api; it does not automatically say which team owns the path, which dependency is in scope, which deploy produced the signal, or which non-production services should stay out of the response.
Coralogix signal        anyshift-coralogix-lab / checkout-api
Anyshift context        owner, service, recent change, dependency, skip reasons
Coralogix API           Custom Dashboard with reviewed Markdown handoff
Coralogix stays the operational surface. Anyshift, through annie do, answers what the signal means in production before the dashboard becomes the shared review surface.
Why A Dashboard Alone Misses The Owner
A Coralogix Custom Dashboard is the right place to put operational context. Teams can build widgets around logs, metrics, traces, DataPrime widgets, and Markdown notes; they can reuse the dashboard during an incident or a deploy review.
But the dashboard still needs the right context. A DataPrime query can find the log:
source logs
| filter anyshift_probe_id == 'anyshift-coralogix-1781015483'
| limit 5
That query proves the telemetry exists. It does not prove the owner, blast radius, recent deploy, or response boundary. Without that join, an SRE still has to ask around: is this checkout, payments, platform, or a dev-only subsystem?
That answer lives outside the telemetry query, across deploy history, owners, runtime dependencies, monitor mappings, and Anyshift's production graph.
The Context Anyshift Adds

For the checkout rollout, Anyshift maps the Coralogix-visible signal to the production facts the dashboard needs:
- Affected service:
checkout-api, not every subsystem that happens to share a naming pattern. - Owner:
payments-platform, the team that should review checkout impact. - Recent change:
deploy-2026-06-09-coralogix-lab, the rollout that emitted the probe. - Coralogix target: application
anyshift-coralogix-lab, subsystemcheckout-api, matching Coralogix's application/subsystem naming model. - Evidence: the DataPrime query returns the probe in the Coralogix tenant.
- Skip reason: non-production services stay out of the operational handoff.
That is the Anyshift part of the workflow: collect the production facts first, then write only after review.
Review First, Then Coralogix Writes
The SRE starts with a plain-English request:
annie do "write Coralogix dashboard context for this checkout deploy"annie do is Anyshift's reviewed workflow surface. It asks the Anyshift graph for affected services, owners, evidence, and Coralogix targets, then renders deterministic API steps. The runbook is the review boundary: the SRE sees what will be written before the Coralogix API call runs.

After approval, the workflow crosses the boundary to Coralogix's native APIs:
POST /api/v1/dataprime/query
POST /mgmt/openapi/5/dashboards/dashboards/v1
GET  /mgmt/openapi/5/dashboards/dashboards/v1/<dashboard_id>
The DataPrime call verifies the signal. The Dashboards API call creates the Custom Dashboard. The final GET verifies the object exists and contains the reviewed handoff.
The Result In Coralogix
The workflow created a Coralogix Custom Dashboard in the tenant. The dashboard contains the reviewed Markdown handoff next to the telemetry query: probe ID, DataPrime query, affected service, owner, recent change, and the boundary between Coralogix's operational surface and Anyshift's production graph.
That is the handoff that matters. An SRE can stay in Coralogix and still see the production facts that would otherwise live in a graph, deploy tool, incident thread, or someone's memory.
Why DataPrime Alone Is Not Enough
DataPrime is strong at querying telemetry. It can filter, transform, and aggregate logs, metrics, and traces inside Coralogix. That is the native capability this workflow relies on.
The gap is scope. A query can find checkout-api; it does not know whether checkout-api-dev should be skipped, whether payments-platform owns the path, whether this signal came from a specific deploy, or whether the next action should tune alert routing instead of paging a broad on-call group.
Anyshift is not replacing Coralogix dashboards, queries, alerts, or ownership inside the product. It adds the production context an SRE needs next to the telemetry they are already using.
What Coralogix Teams Get
For Coralogix users, the workflow is simple:
- A dashboard that starts from a real telemetry query.
- A reviewed service and owner handoff before the dashboard is created.
- A saved explanation for why the signal maps to
checkout-api. - A clear skip boundary for non-production services.
- A native Coralogix object that responders can open during deploy review or incident triage.
The nearby workflows follow the same shape: add Anyshift context before alert routing, annotate deploy dashboards with graph evidence, or turn a DataPrime query into a reviewed incident handoff.
If your team uses Coralogix and wants production context in dashboards instead of manual owner lookup from telemetry alone, contact us.