In an online marketplace, imagine payment timeouts begin climbing eight minutes after a new checkout-api rollout.
The company uses ClickStack, the ClickHouse-powered observability stack for logs, metrics, and traces. It catches the spike immediately.
But questions remain: Did that rollout cause it? Who owns the affected path? What could fail next?
That is where Anyshift comes in. It connects the signal to deployment history, Kubernetes, Git/IaC, ownership, monitors, and runtime dependencies. This gives the on-call team a likely change, owner, blast radius, and next action that can be queried back in ClickStack.

What ClickStack Sees and What Anyshift Adds
| ClickStack provides | Anyshift adds | Together |
|---|---|---|
| Telemetry, SQL, charts, and alerts | Live owner, recent change, blast radius, monitors, and environment boundaries | A native alert result with the right team and next action |
How to Trace the Timeout Through Anyshift’s Production Graph
In this scenario, the on-call engineer responsible for checkout can see the timeout spike in ClickStack, but not its cause or production impact.
To understand what happened and choose the right response, they need four answers: what changed, what depends on checkout-api, which services are affected, and who owns the response.
That is how Anyshift enters the investigation. The Anyshift Graph API is built for production scale: queries return in milliseconds across graphs with millions of nodes and edges, and scale linearly as the graph grows. Resolving those relationships before inference also cut model-token usage by 83.5% in our live benchmark.
The engineer asks the four questions with annie graph query "<query>" --output json:
-- Recent deploys
SELECT * FROM deploy_impact
WHERE target = checkout-api
  AND since = 2h
LIMIT 10;
-- Downstream blast radius
SELECT * FROM blast_radius
WHERE resource = checkout-api
LIMIT 30;
-- Alert impact
SELECT * FROM alert_impact
WHERE resource = checkout-api
LIMIT 20;
-- Production owner
SELECT * FROM gitops
WHERE subject = owner
  AND resource = checkout-api
LIMIT 10;
After evaluating the relevant resources and relationships across the production graph, Anyshift returns one focused answer in milliseconds:
{
  "review_id": "checkout-payment-timeouts-2026-07-29",
  "signal": "checkout-api payment timeout spike",
  "suspected_change": {
    "deployment": "checkout-api 2026.07.29-1",
    "timing": "eight minutes before the spike",
    "confidence": "high"
  },
  "services": [
    {
      "service": "checkout-api",
      "owner_team": "payments-platform",
      "affected_services": [
        "checkout-web",
        "order-orchestrator",
        "billing-worker"
      ],
      "recommended_action": "pause rollout 2026.07.29-1 and page payments-platform"
    },
    {
      "service": "billing-worker",
      "owner_team": "revenue-platform",
      "affected_services": ["invoice-writer"],
      "recommended_action": "watch invoice queue age while payments-platform rolls back checkout-api"
    }
  ],
  "excluded": {
    "service": "checkout-api-sandbox",
    "reason": "checkout-sandbox is not production"
  }
}
This answers the engineer’s original questions: rollout 2026.07.29-1 is the likely change; payments-platform owns the primary path; three production services are exposed; and the sandbox path is excluded.
Write the Reviewed Answer Back to ClickHouse
Before anything is written, the engineer can reject the suspected rollout, remove a service, or stop. After approval, Anyshift adds two small ClickHouse objects: anyshift_production_context stores the reviewed evidence, and anyshift_clickstack_alert_context exposes it in ClickStack-ready fields.
The on-call engineer verifies the handoff with:
SELECT
  ServiceName AS service,
  owner_team AS owner,
  risk_level AS risk,
  production_risk_score AS score,
  affected_services_csv AS affected,
  recommended_action AS action
FROM anyshift_clickstack_alert_context
WHERE review_id = 'checkout-payment-timeouts-2026-07-29'
ORDER BY score DESC;
The result is shown below in ClickStack, where the reviewed owner, risk, affected services, and next action appear as native ClickHouse fields.
Query the Reviewed Context Natively in ClickStack
Once the reviewed answer is in ClickHouse, the on-call engineer stays in the tool where the spike appeared. ClickStack reads the view through its existing query surface.
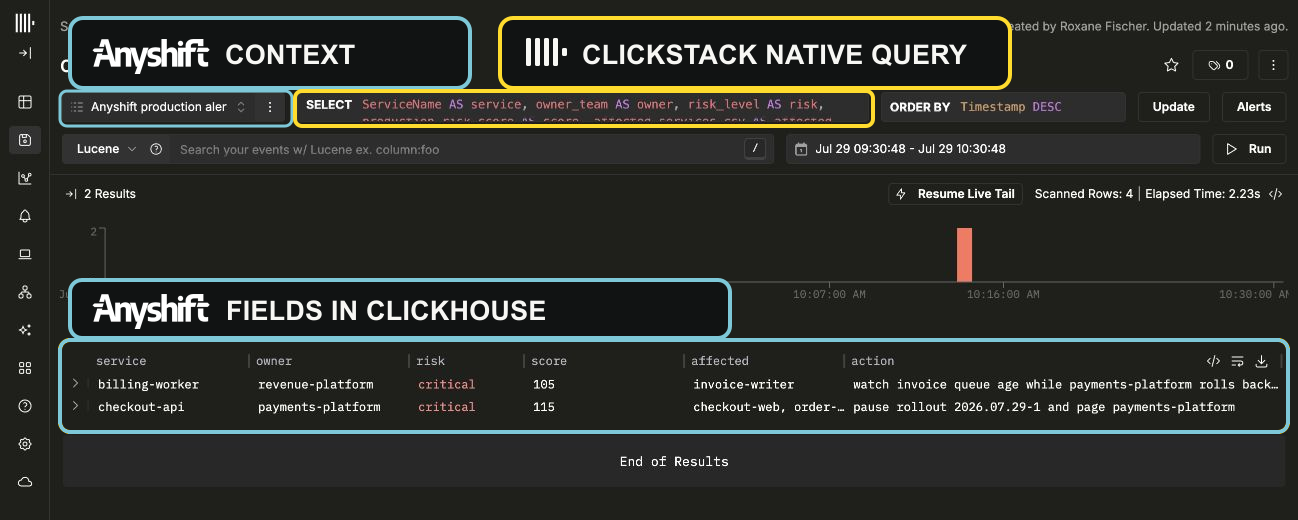
The signal now carries an owner, a likely change, a bounded blast radius, and a next action: pause rollout 2026.07.29-1, page payments-platform, and watch invoice lag. Saved searches, charts, and alerts can use the same fields without moving the response out of ClickStack.
What’s Next
The next ClickStack workflows are close to this one.
- Pre-alert context. When a saved search detects a spike, a ClickStack workflow can ask Anyshift for the current owner, likely recent change, and blast radius before the alert is routed. The answer stays queryable in ClickHouse beside the signal.
- Production-impact dashboards. Because the reviewed fields live in ClickHouse, teams can chart incidents by owner, rollout, risk level, or affected service instead of rebuilding those relationships during each incident.
- Agent-ready investigation. The same view can give an on-call assistant a focused answer to questions such as: checkout timeouts increased; what changed, who owns the path, and what should we check next?
For ClickStack, the next step is simple: keep detection where it already happens and make current production context available before the response begins.
Have a ClickStack workflow where production context is missing? Bring us one case. We will map it with you.
Explore the full Graph API capability reference for more SDK examples and production questions.